Water Stabilization Project Summary
The Briggs Lake Chain experiences frequent periods of high water resulting in localized flooding and the need for observance of a No-Wake Ordinance. Therefore, water level stabilization is a priority for the residents.
In 2018, the Three Lake Improvement District (TLID) hired Wenck Associates to assess the cause(s) of the high-water conditions. They identified three hydrologic/hydraulic alternatives to improve water level stabilization and improve lake outlets. Potential positive impacts on Aquatic Invasive Species (AIS) control and water quality for each alternative were also evaluated.
In 2020, Wenck concluded that the Bayou channel flow can be highly correlated to the overspill of the No-Wake zone limits in the lake chain. Three remediation alternatives were proposed:
- A sheet pile weir be constructed underground at mouth of the Bayou channel
- A wetland area upstream from the Bayou be impounded by an earthen berm
- Increased crop cover be used in the watershed
The sheet pile weir structure is expensive, but would have the potential to provide permanent water elevation control. In addition, it would help reduce sediment flow from the sand delta and scouring within the wetland due to flow increase in the channel. Further, it could have a positive effect on the Briggs Lake Chain water quality, by reducing the amount of sediment and phosphorus entering the lakes. Each of the alternatives is being examined along with potential funding methods. (See Water-Stabilization-Introduction for detailed explanation) Funding for such projects in the future will likely require a One Watershed plan to be completed. We need to start this process. (see guidebook)
Other discussion

Water Level Logger
A waterlogger is automatic system to record lake levels.
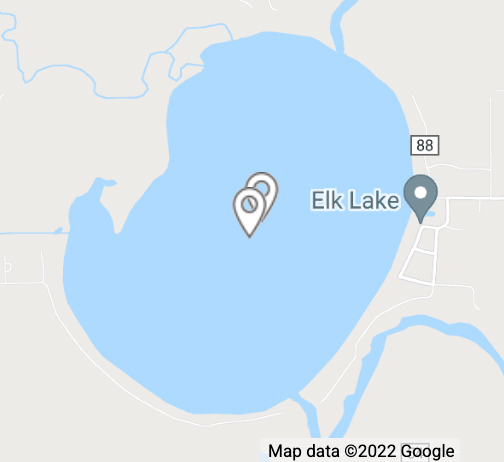
The TLID has borrowed a Water Level Logger from the MPCA to monitor levels on Briggs. (measured every half hour & not available real time)
The TLID purchaced a waterlogger deployed on ELK lake which can be viewed real time from the linked web site below.(measured every hour)
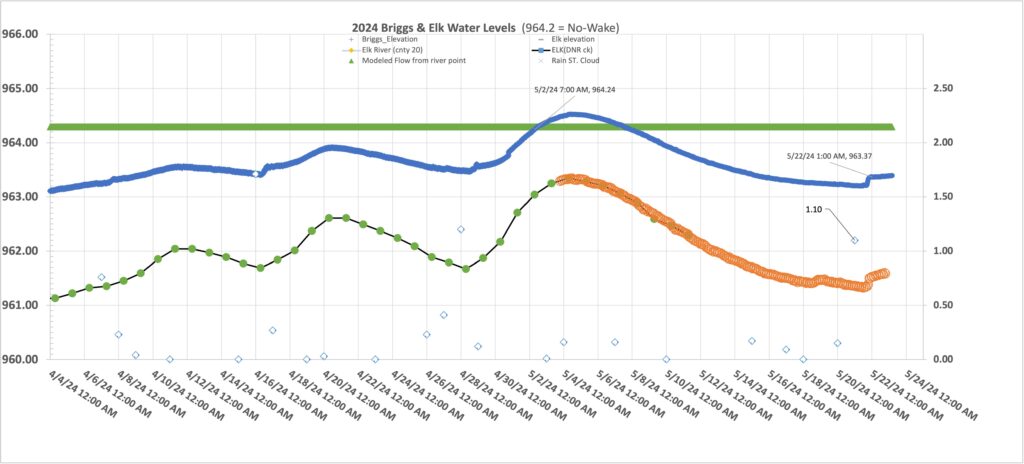
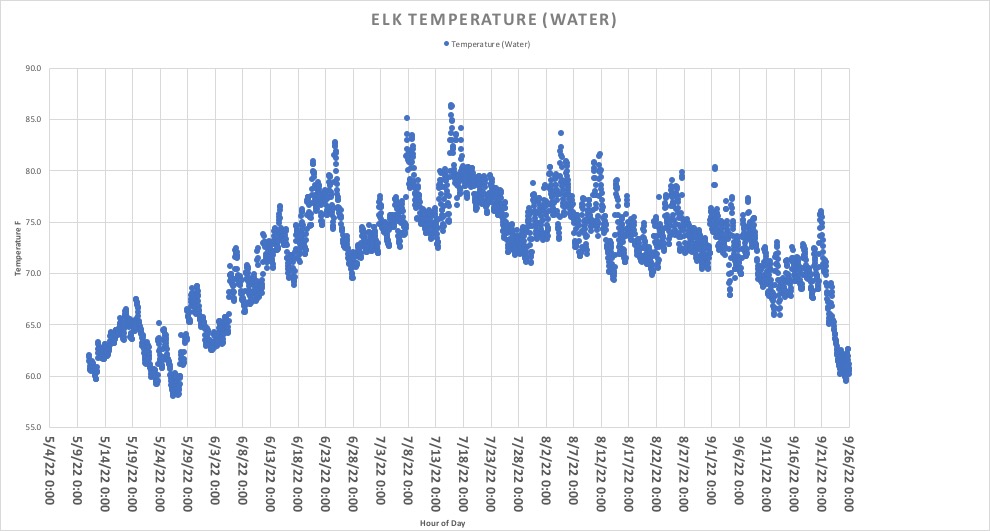
Water Levels and Temperature Charts (2024)
Hourly measurements are matched by time stamp and graphed below.
Briggs measurements are a radar device that runs on solar power and not damaged by cold weather, however the data had issues in the winter when battery levels were low and snow/ice affected radar signal.
Elk measurements are taken with a pressure transducer which would be damaged if exposed to freezing weather, so equipment is brought indoors during the winter. Calibration after spring deployment will be done as data is available from DNR site.
Red line in chart indicates estimated point where river level flows into Briggs lake (Per engineering report)

Water Levels and Temperature Prior Years

5/23 – About 2.4 inches above no wake , levels should be back around Tuesday and high water restrictions gone Thursday –
5/24- Hit highwater line last night – Need 3 consecutive days below it to remove no-wake per ordinance 115…
5/26- Curly Leaf treatment (day before expected no wake end).
6/10- Curly Leaf warning signs can be removed.
6/26- Water risen about 8 inches (7 inches from no wake ord level) cause = 4 inch rain on the 23rd…
6/28- Briggs level reads 2 inches from no wake ord level. (Started to level off yesterday around noon. Then more rain last night)
6/30 – clearly past peak!
7/5- Small amounts of rain keeping lake levels at slightly higher than typical….
Briggs using calibrated values from 2021 Elk calibrated to this spring….
River levels are monitered with same device as Briggs but at least a month delay needed to obtain and much longer to process.
River data official values published after end of year validation by state experts, at which time there will be a comprehensive data set to model water elevations.

Extra Testing Done in 2019:
• Periodic flow velocity measurements
• Tape-down measurements (stream height)
• Water quality sampling
• Precipitation events
• Baseline conditions