Mission
To promote the care, improvement and general welfare of the Briggs Lake Chain and adjoining and connecting waterways.
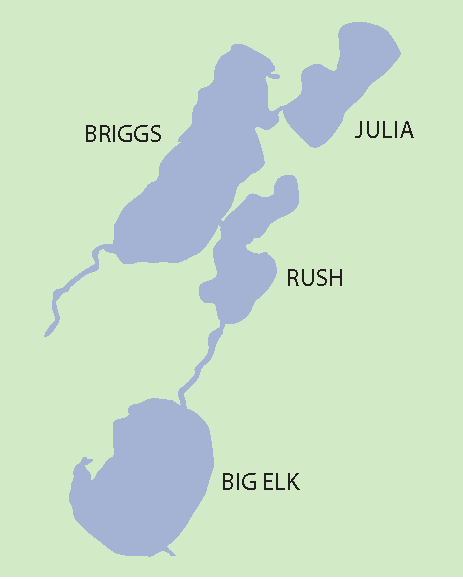
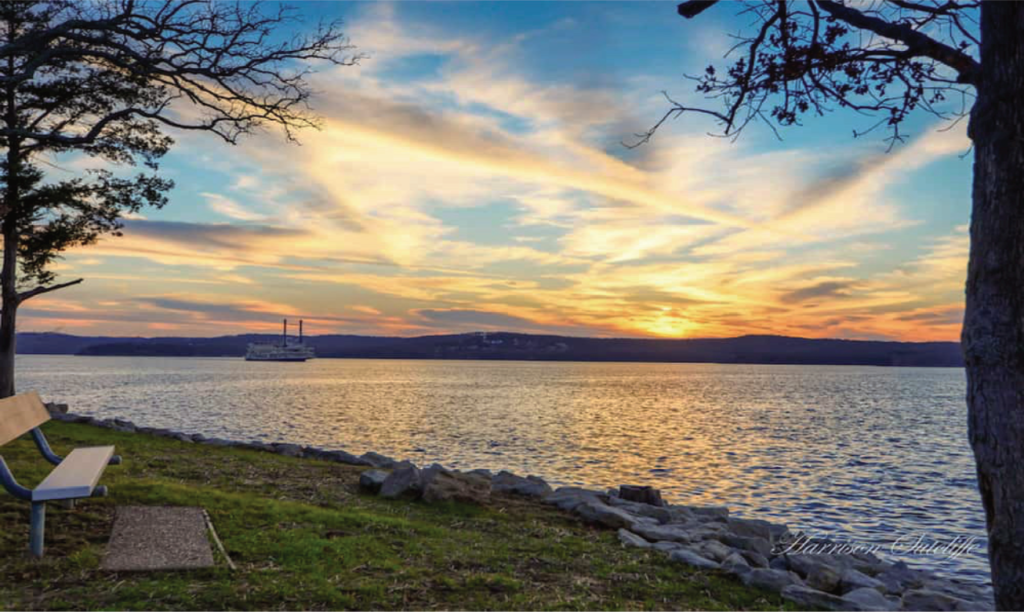
The Briggs Lake Chain of lakes includes Briggs, Julia, Rush and Big Elk lakes near Clear Lake in Sherburne County, Minnesota.
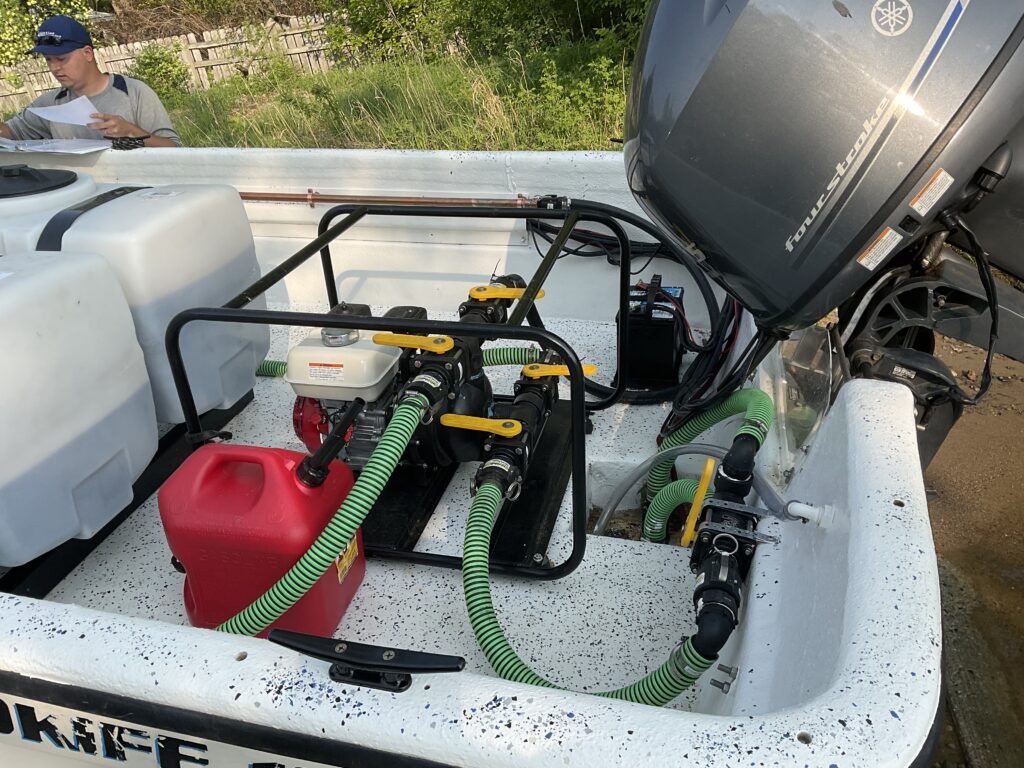
The Three Lake Lake Improvement District (TLID) is a local government unit for the upper three lakes, and is therefore a more formal organization. Its charge is to manage aquatic invasive species and other projects.
Join the BLCA – Online Registration
Click here
Click here to see our newsletters, and sign up to receive newsletters
BLCA general meetings are held in June and August
TLID annual meetings are held in August.
Both are held at:
Palmer Town Hall
4180 105th Ave., Clear Lake, MN
For specific dates, please see our Calendar.
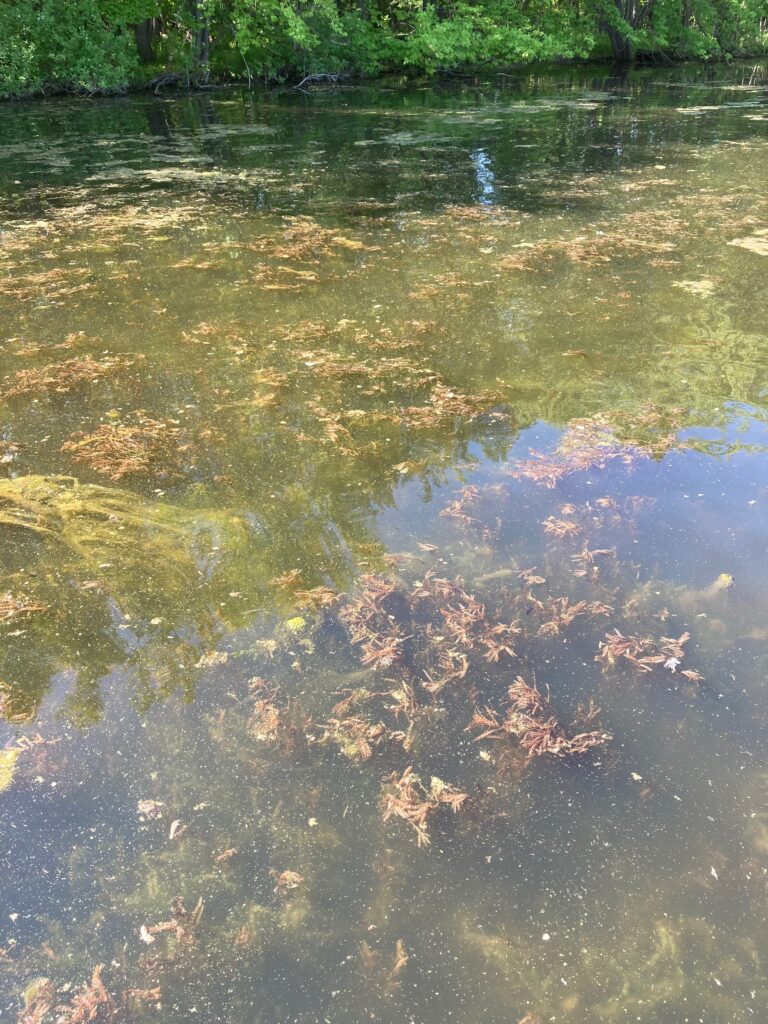
AIS Information
Click here to learn more about AIS and sign up for control
Aquatic invasive control company for public waters, Learn more about PLM Corp.
High Water Notice:
A High Water Notice will be issued requiring a Slow – No Wake speed at all times when water levels exceed 964.2 feet on Briggs Lake, Rush Lake, or Lake Julia, and/or 962.2 feet on Big Elk Lake.
Briggs, Julia, Rush, and Big Elk have no event at this time.
Stay tuned for further updates
Area Special Events:
Independence Day Boat Parade and Fireworks: July 5, 2025

2024 Water Testing Results
View results of the 2024 water testing below. Results include graphs of the findings. A huge thank you to Walt Munsterman and the whole water testing team!
Below is the 2023 Water testing results, including the graphs, a report to the township board, and a list of the water testing volunteers and testing dates.
New Boater Education Law
Starting on July 1, 2025, a new law will require some adults and youth who operate motorboats—including personal watercraft—to have a valid watercraft operator’s permit.
Contact Us
We can be contacted also at blca@briggslakechainassociation.com